How to Build an Org Chart in Microsoft Visio (Web App Step-by-Step)
Discover how to create a clear and detailed organizational chart using Microsoft Visio with our comprehensive guide. Learn to navigate Visio's features for a professional depiction of your company's hierarchy.

If you’re already in the Microsoft 365 ecosystem, Microsoft Visio is often the first place people turn when they need an org chart.
The good news: Visio can absolutely create a clean, professional org chart.
The catch: it’s easy to get lost in shapes, connectors, and layouts if you’re not in the tool every day.
This guide walks you through exactly how to build an org chart in the Microsoft Visio web app, how to find more templates, and when Visio is (and isn’t) the best choice for visualizing your reporting structure.
You’ll learn how to:
- Create a basic org chart using a Visio template
- Add roles, reporting lines, and employee details
- Explore additional org chart templates in Visio
- Weigh the pros and cons of using Visio vs dedicated org chart tools
What Is Microsoft Visio and Why Use It for Org Charts?
Microsoft Visio is a diagramming tool in the Microsoft 365 suite. It’s designed for building flowcharts, process diagrams, network maps, and yes, organizational charts.
You can use Visio as:
- A desktop app, with more advanced functionality, or
- A web app, which is easier to access, collaborate in, and keep up to date
For org charts, the Visio web app is usually enough, especially if:
- You want a professional-looking org chart for leadership, HR, or board reporting
- You’re comfortable working in Microsoft 365
- You don’t mind updating the chart manually when your structure changes
How to Manually Build Your Org Chart in Visio (Web App)
Let’s start with the hands-on method: manually building your org chart using the Visio web app.
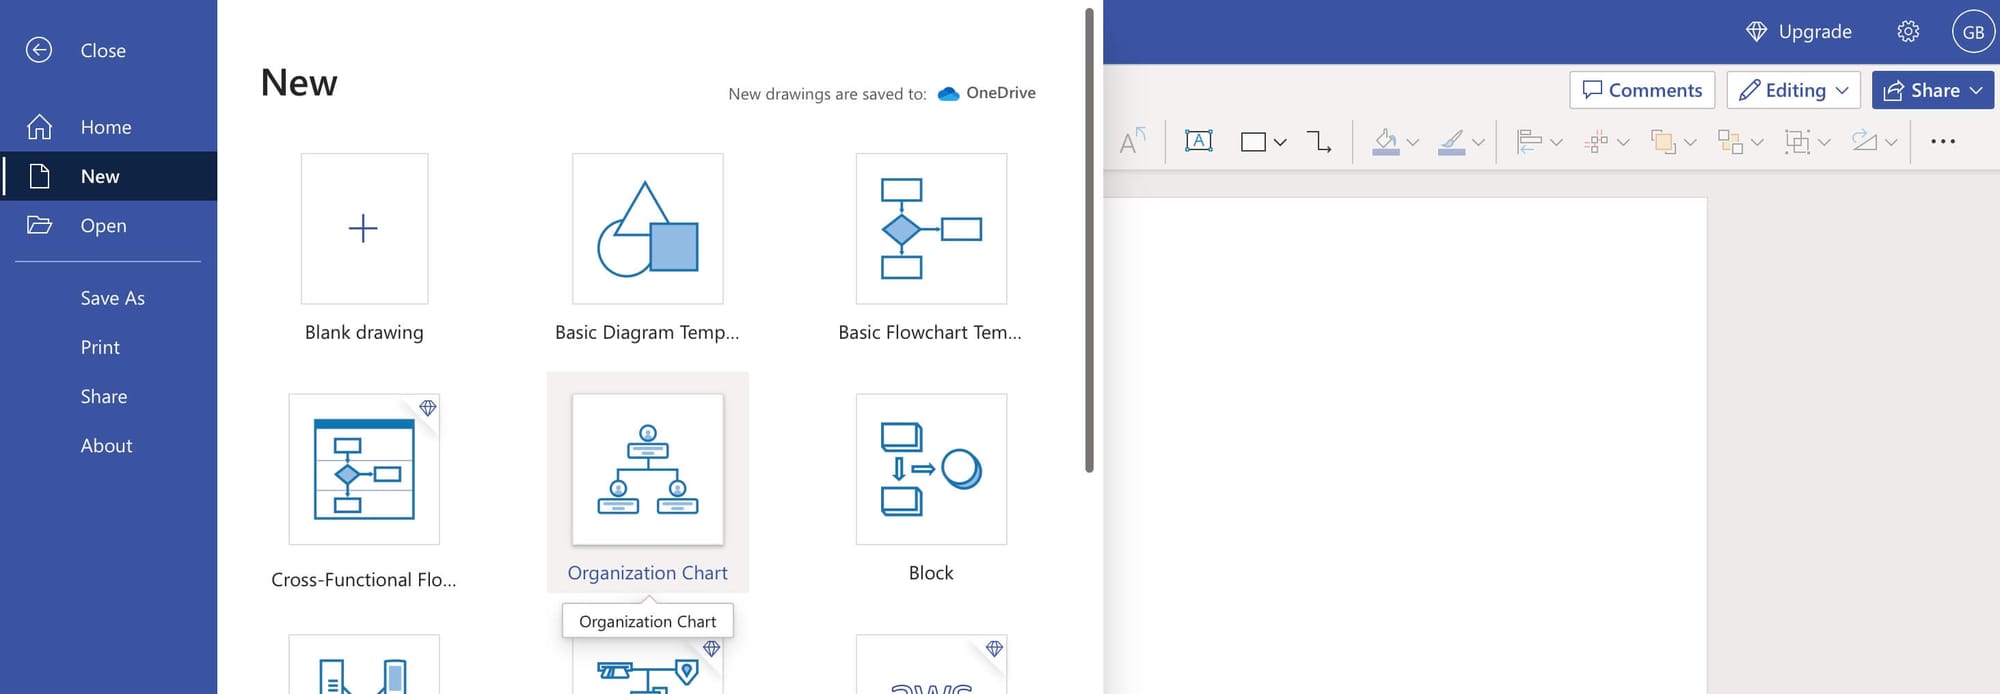
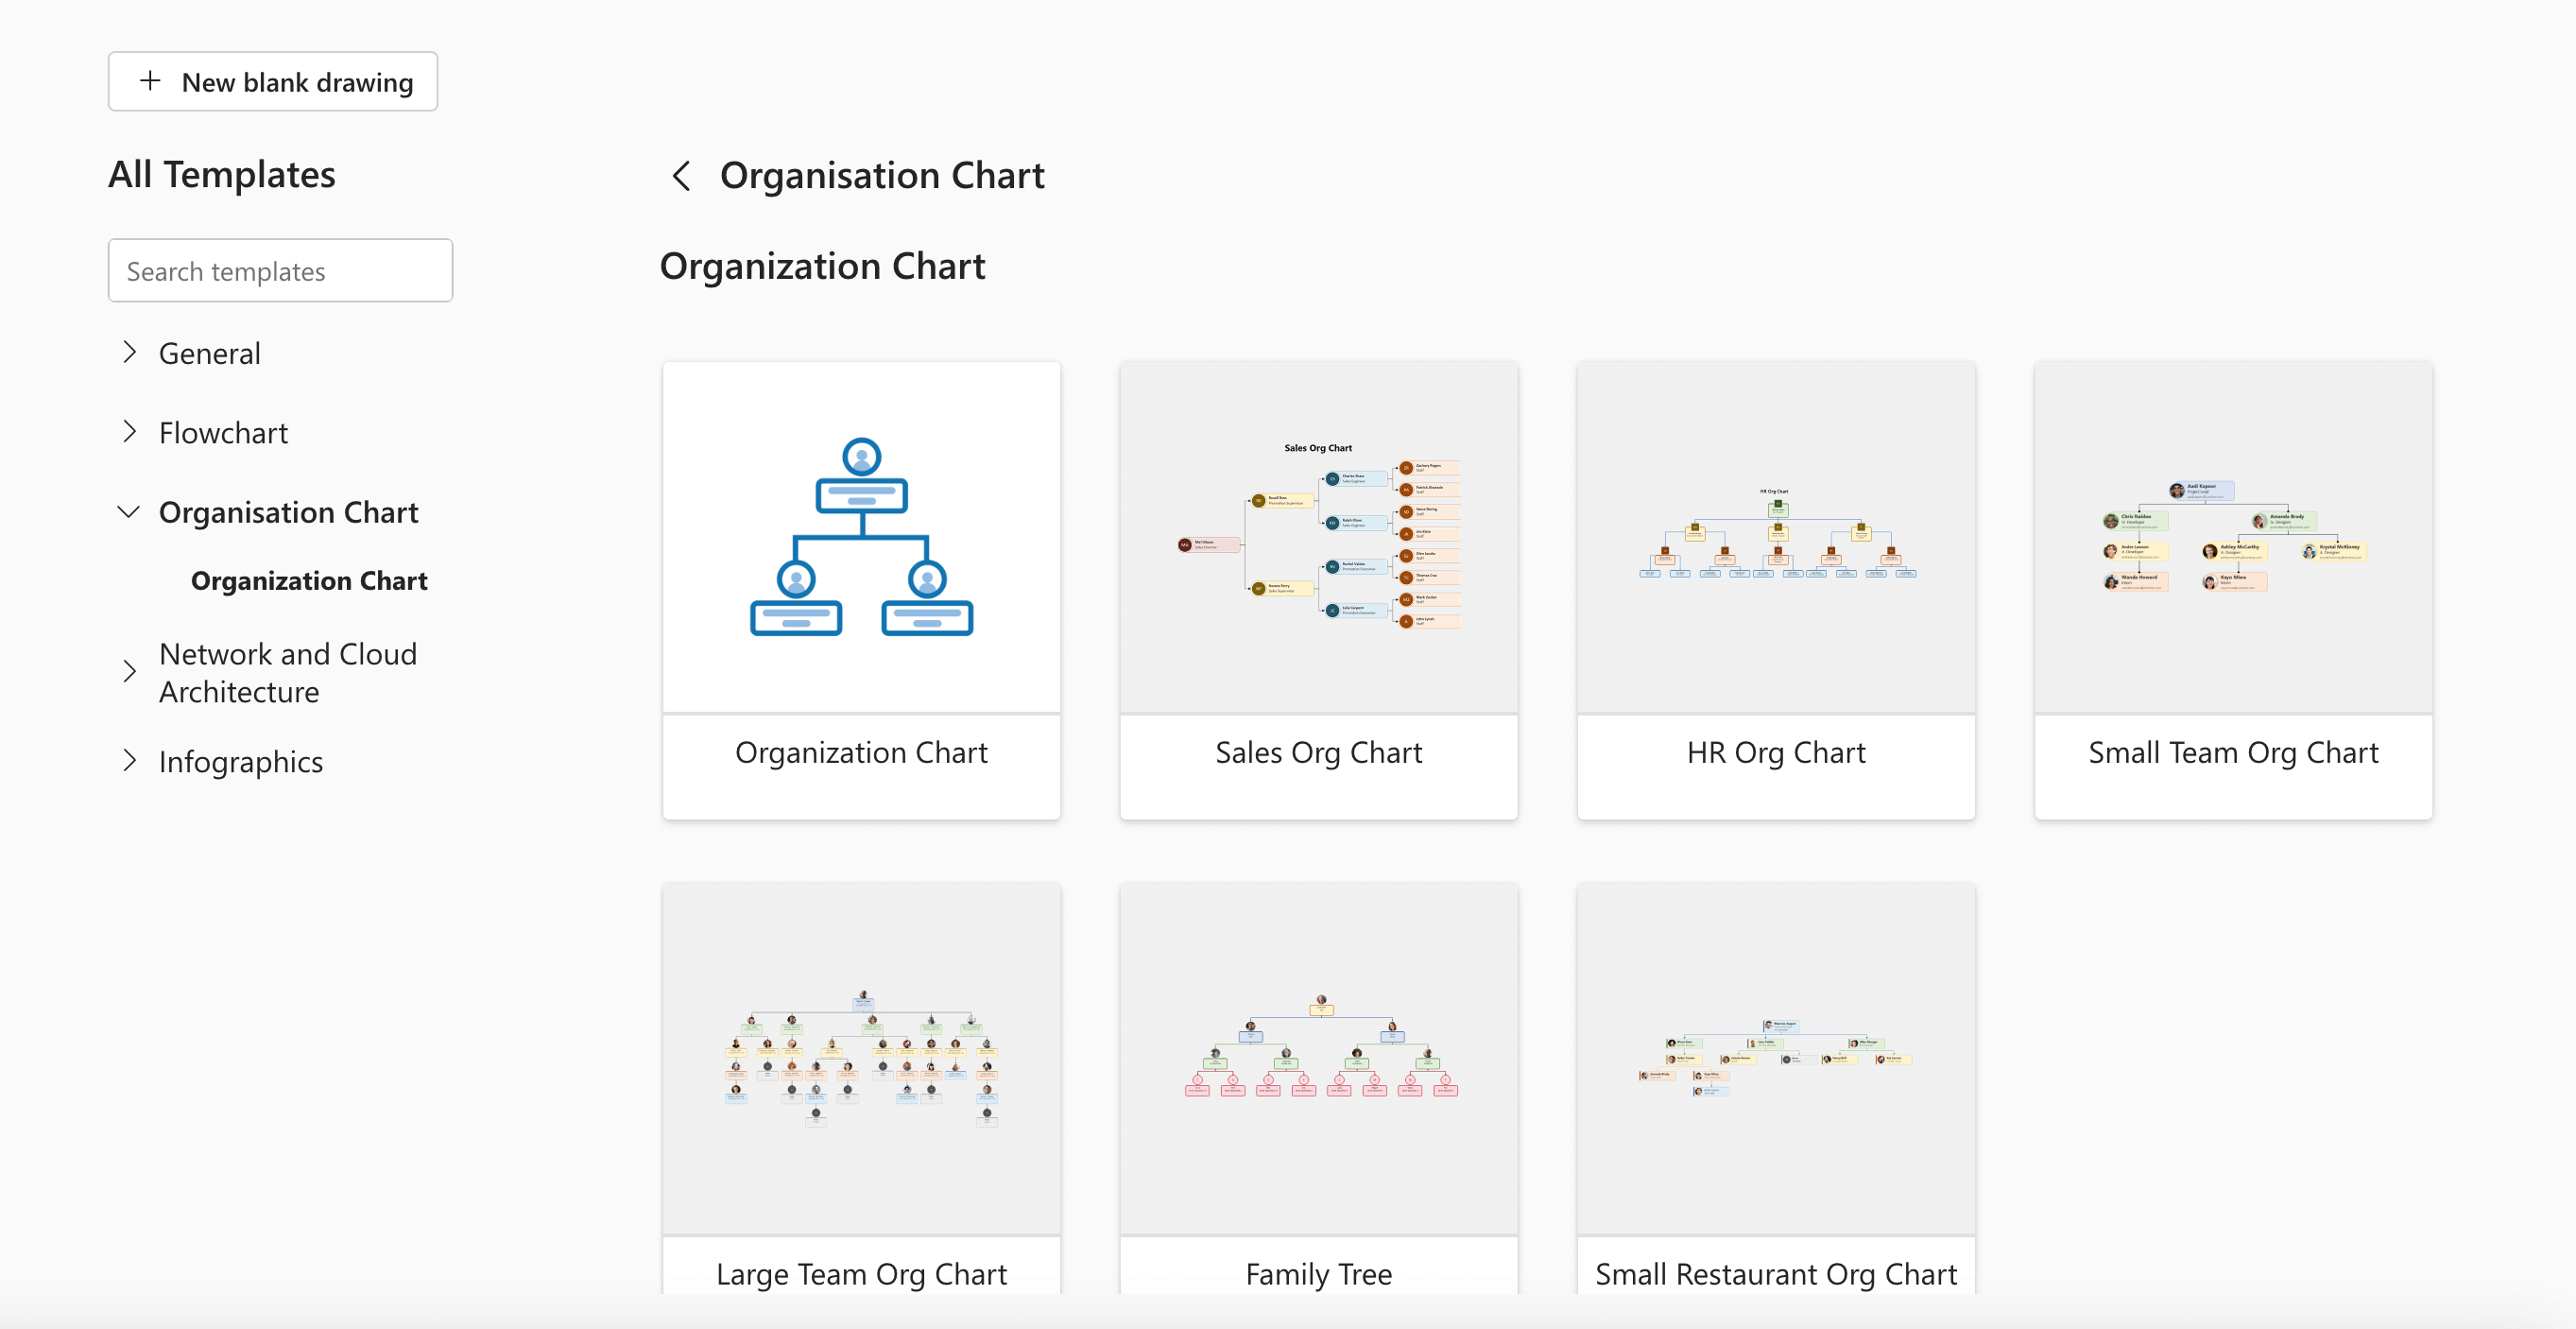
Step 1: Create a New Org Chart from a Template
- Open Visio for the web from your Microsoft 365 portal.
- Go to File → New.
- Choose the Organization Chart category.
- Pick a starting template that matches your layout preference (simple, multi-level, etc.).
- Click Create to open a new diagram.
This gives you a preconfigured workspace with org chart shapes and connectors ready to go.
Step 2: Add Roles and Positions
- In the Org Chart stencil, drag shapes onto the canvas for each role.
- Use:
- Executive shapes for top-level positions
- Manager shapes for mid-level leaders
- Position or Assistant shapes for individual contributors or support roles
- Drop shapes roughly where you want them to appear in the hierarchy. You’ll refine spacing later.
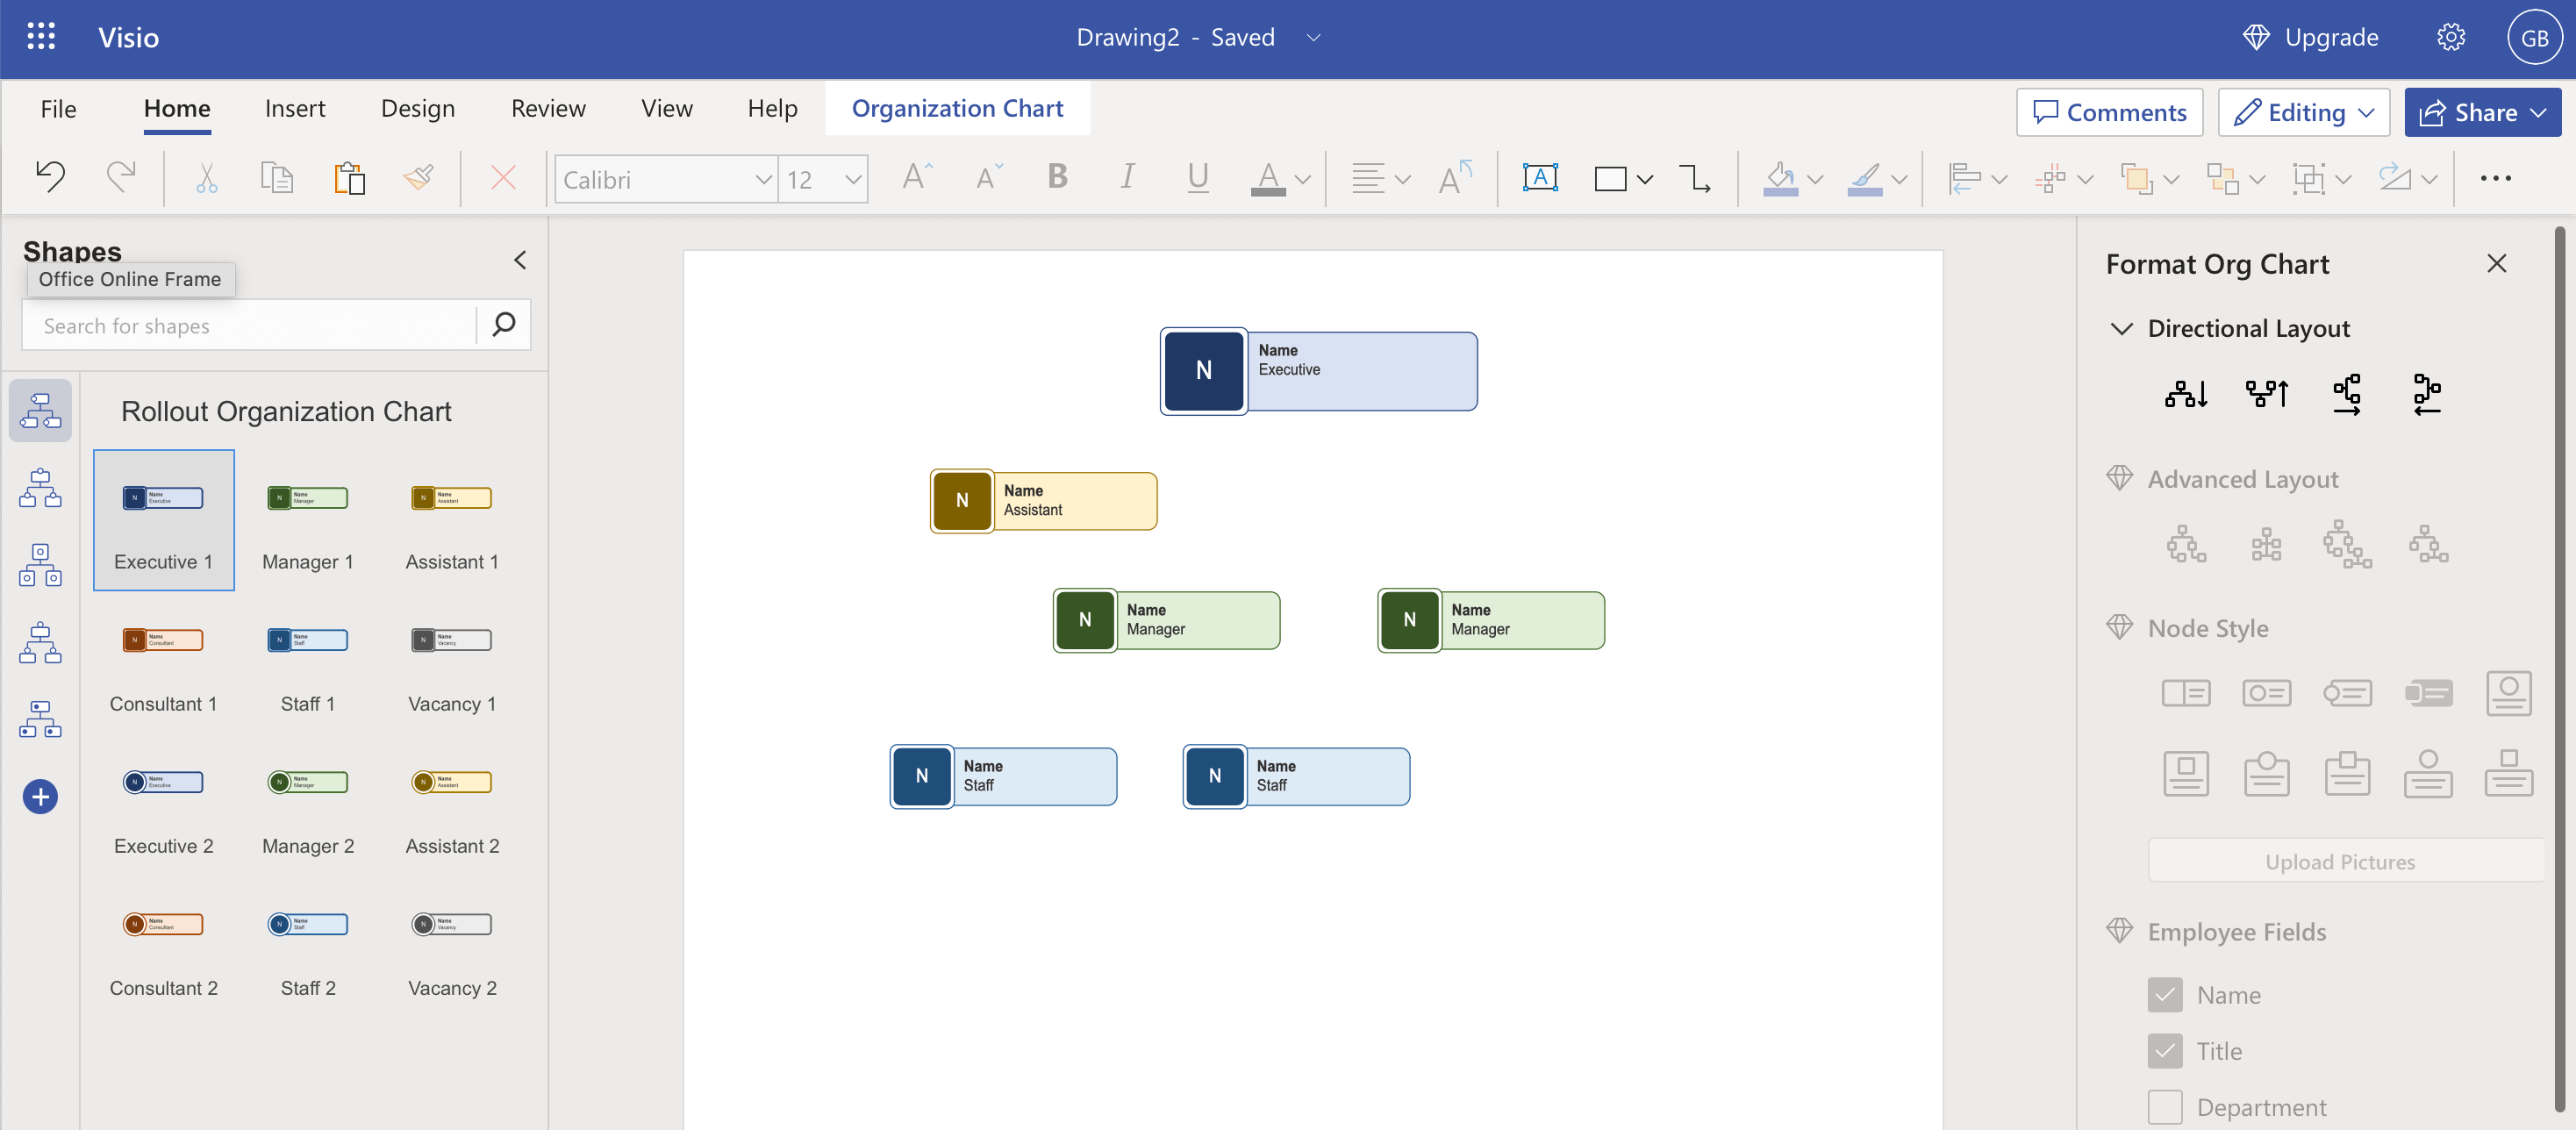
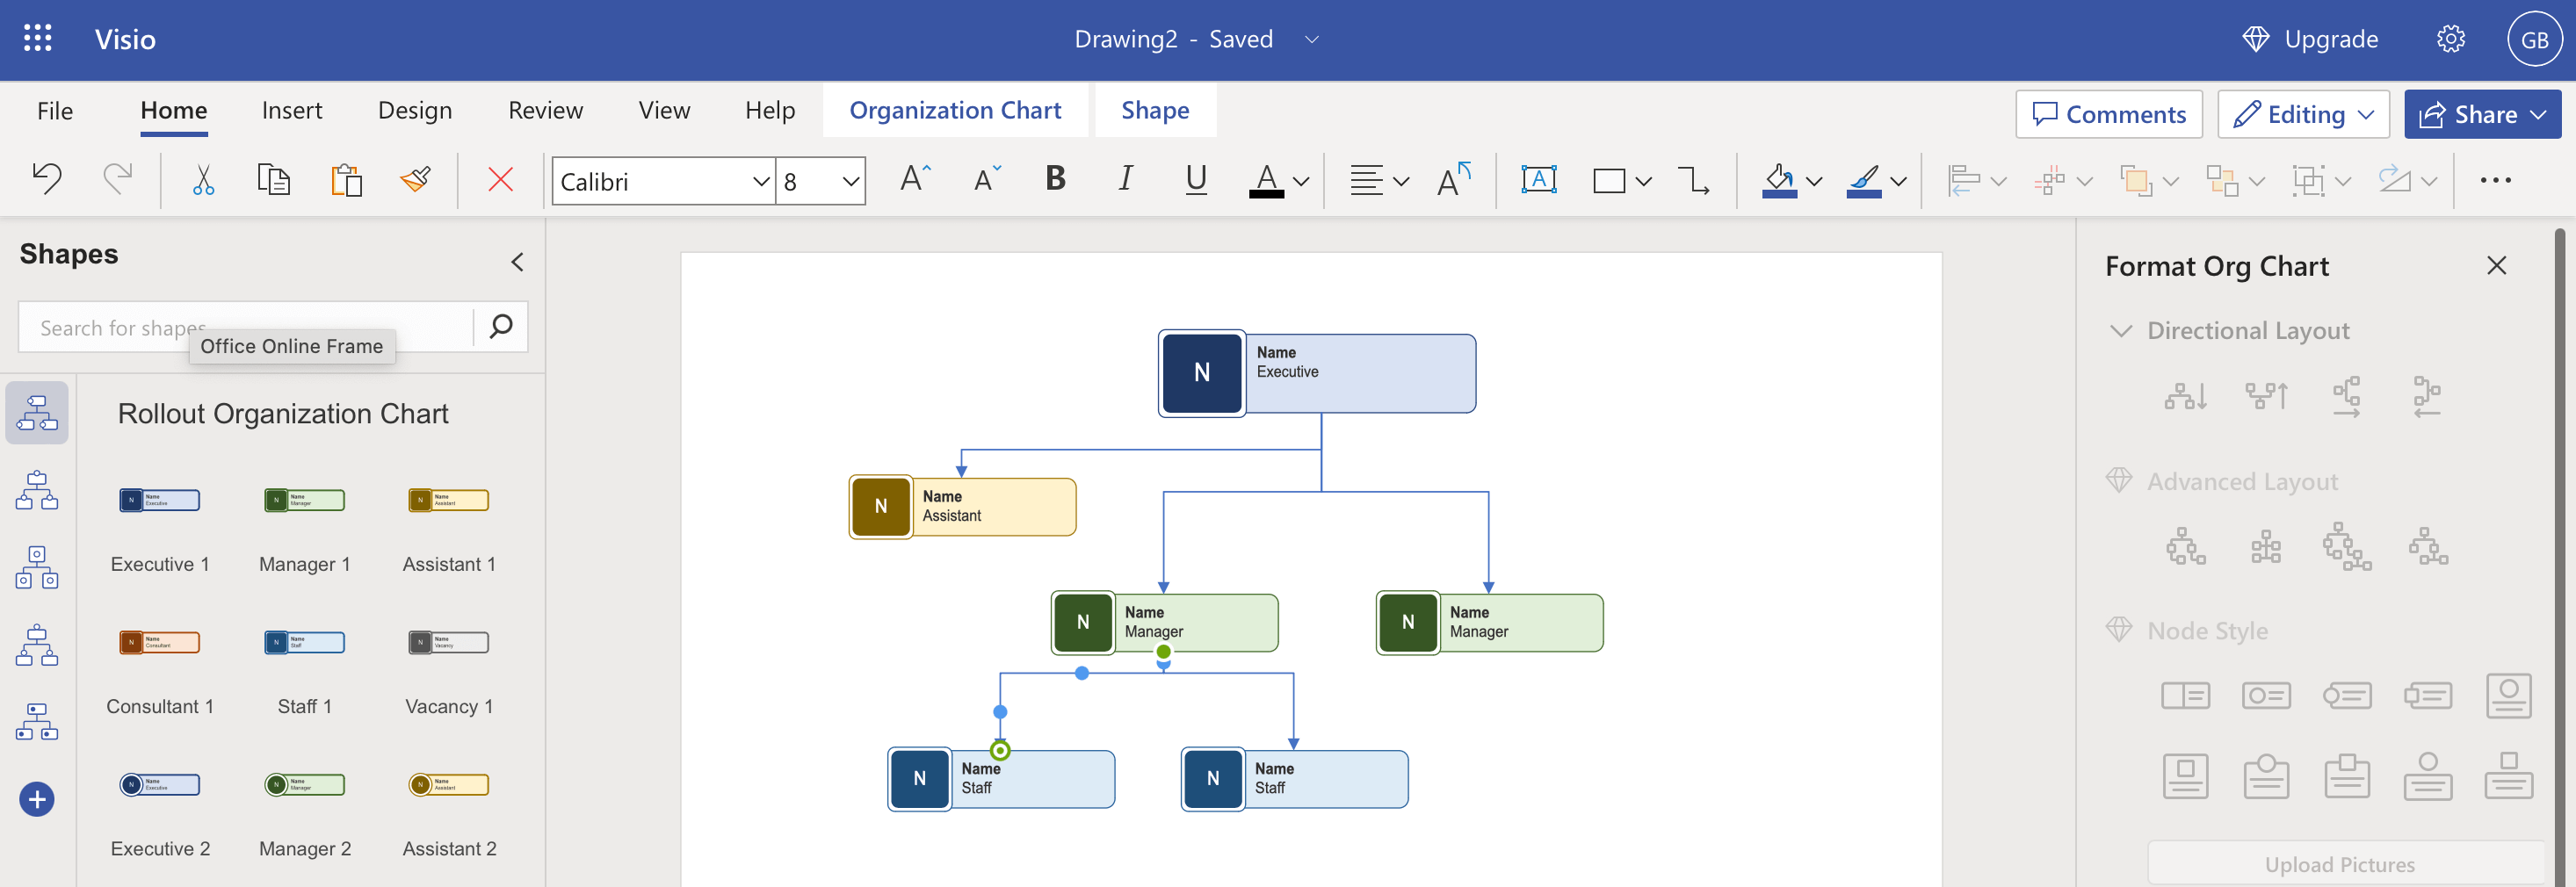
Step 3: Set Up the Reporting Hierarchy
- Use the built-in connectors to show who reports to whom.
- Drag a subordinate shape onto a manager or executive shape to automatically create a reporting line.
- Repeat this for each team or department until your structure is mapped out.
Tip: Keep a simple top-down layout to avoid confusion, especially if you’re sharing the chart outside HR or IT.
Step 4: Add Employee Details
- Click a shape to select it.
- Type the employee’s name, job title, and any other key details you want to show.
- If your template includes data fields or a shape data pane, use those to keep information consistent.
Decide upfront which details matter (e.g. department, location, email) so your chart doesn’t become cluttered.
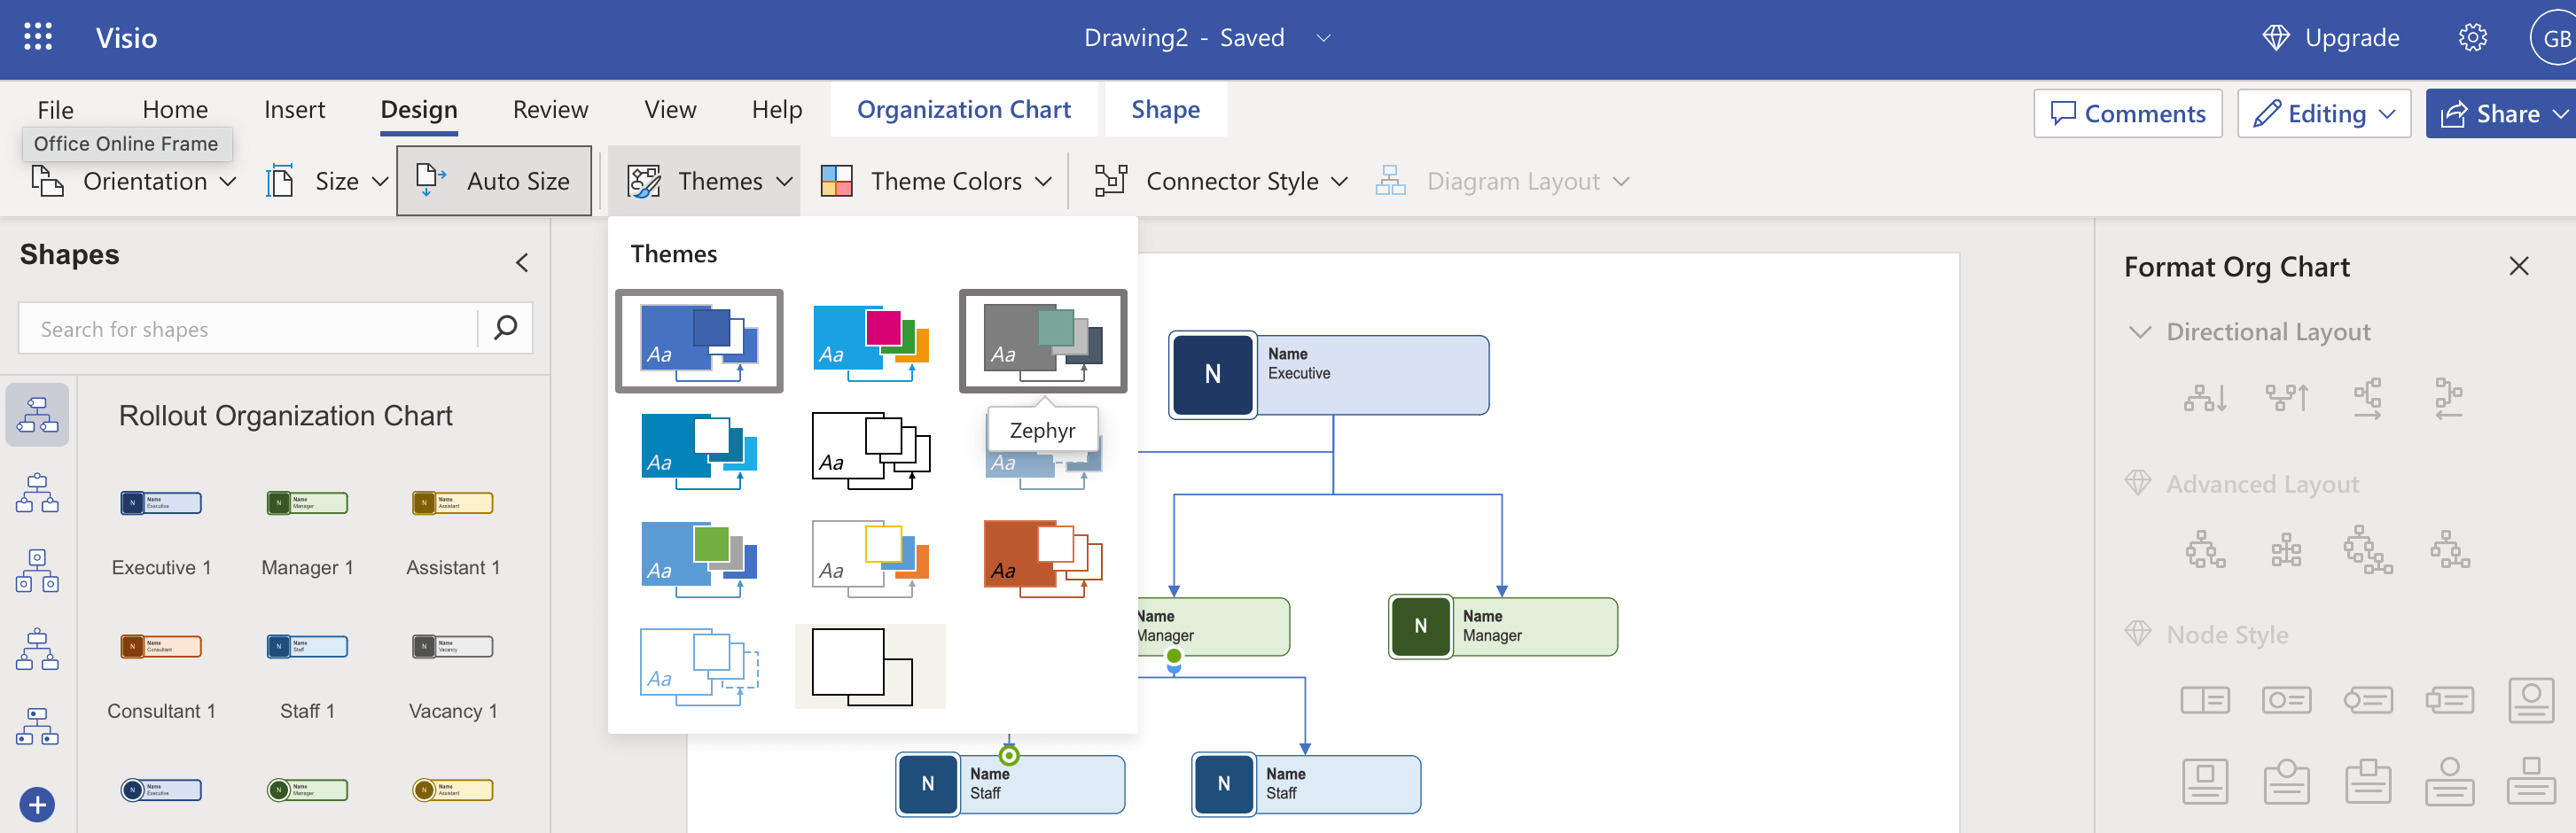
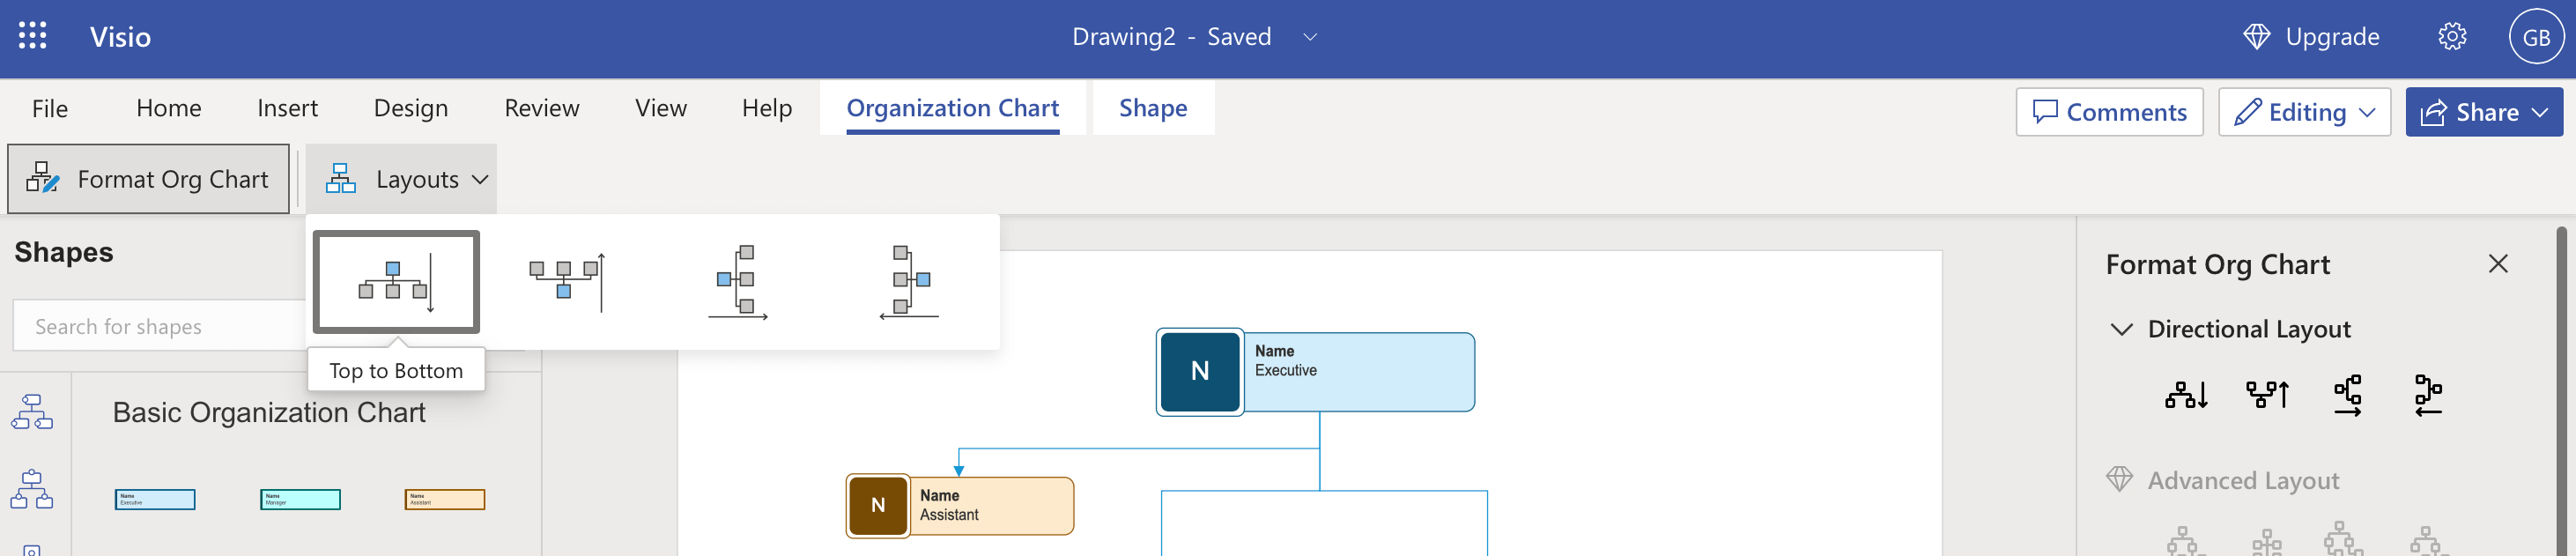
Step 5: Style and Format the Chart
- Go to the Design tab to apply themes and colors that match your brand.
- Adjust:
- Fonts and colors
- Shape styles
- Connector appearance
- Use the Org Chart tab to tweak spacing and overall layout so everything is readable.
Aim for clarity over creativity. If someone has to zoom in 300% just to read job titles, the design needs simplifying.
Step 6: Refine the Layout
- Use the Layout and Arrange options on the Org Chart tab to reposition teams or branches.
- Group related departments or regions together so your structure is easy to scan.
- Adjust spacing so longer names or titles don’t overlap.
A quick pass here makes a big difference for leaders who want to “get it” at a glance.
Step 7: Add Photos (Optional)
- Select the shape where you want a photo.
- Use Insert → Picture (or similar option) to add an image.
- Resize and reposition the photo inside the shape if required.
Photos can help new joiners and distributed teams put faces to names, but they also mean more maintenance when people change roles.
Step 8: Review and Save
- Scan the chart for:
- Missing roles
- Incorrect reporting lines
- Duplicate or outdated information
- Save your org chart via File → Save As.
- Choose the location (e.g. OneDrive or SharePoint) and file format.
Storing the file centrally in Microsoft 365 makes it easier for HR, IT, and leaders to access the latest version.
Step 9: Share Your Org Chart
- Go to File → Share.
- Choose whether to:
- Share a link with colleagues
- Send via email
- Export to PDF or another file format for presentations or reports
Make sure people know how often the chart is updated so they can trust what they’re looking at.
How to Explore More Org Chart Templates in Visio Web App
If the default organization chart template doesn’t quite fit, Visio offers more options in the web app.
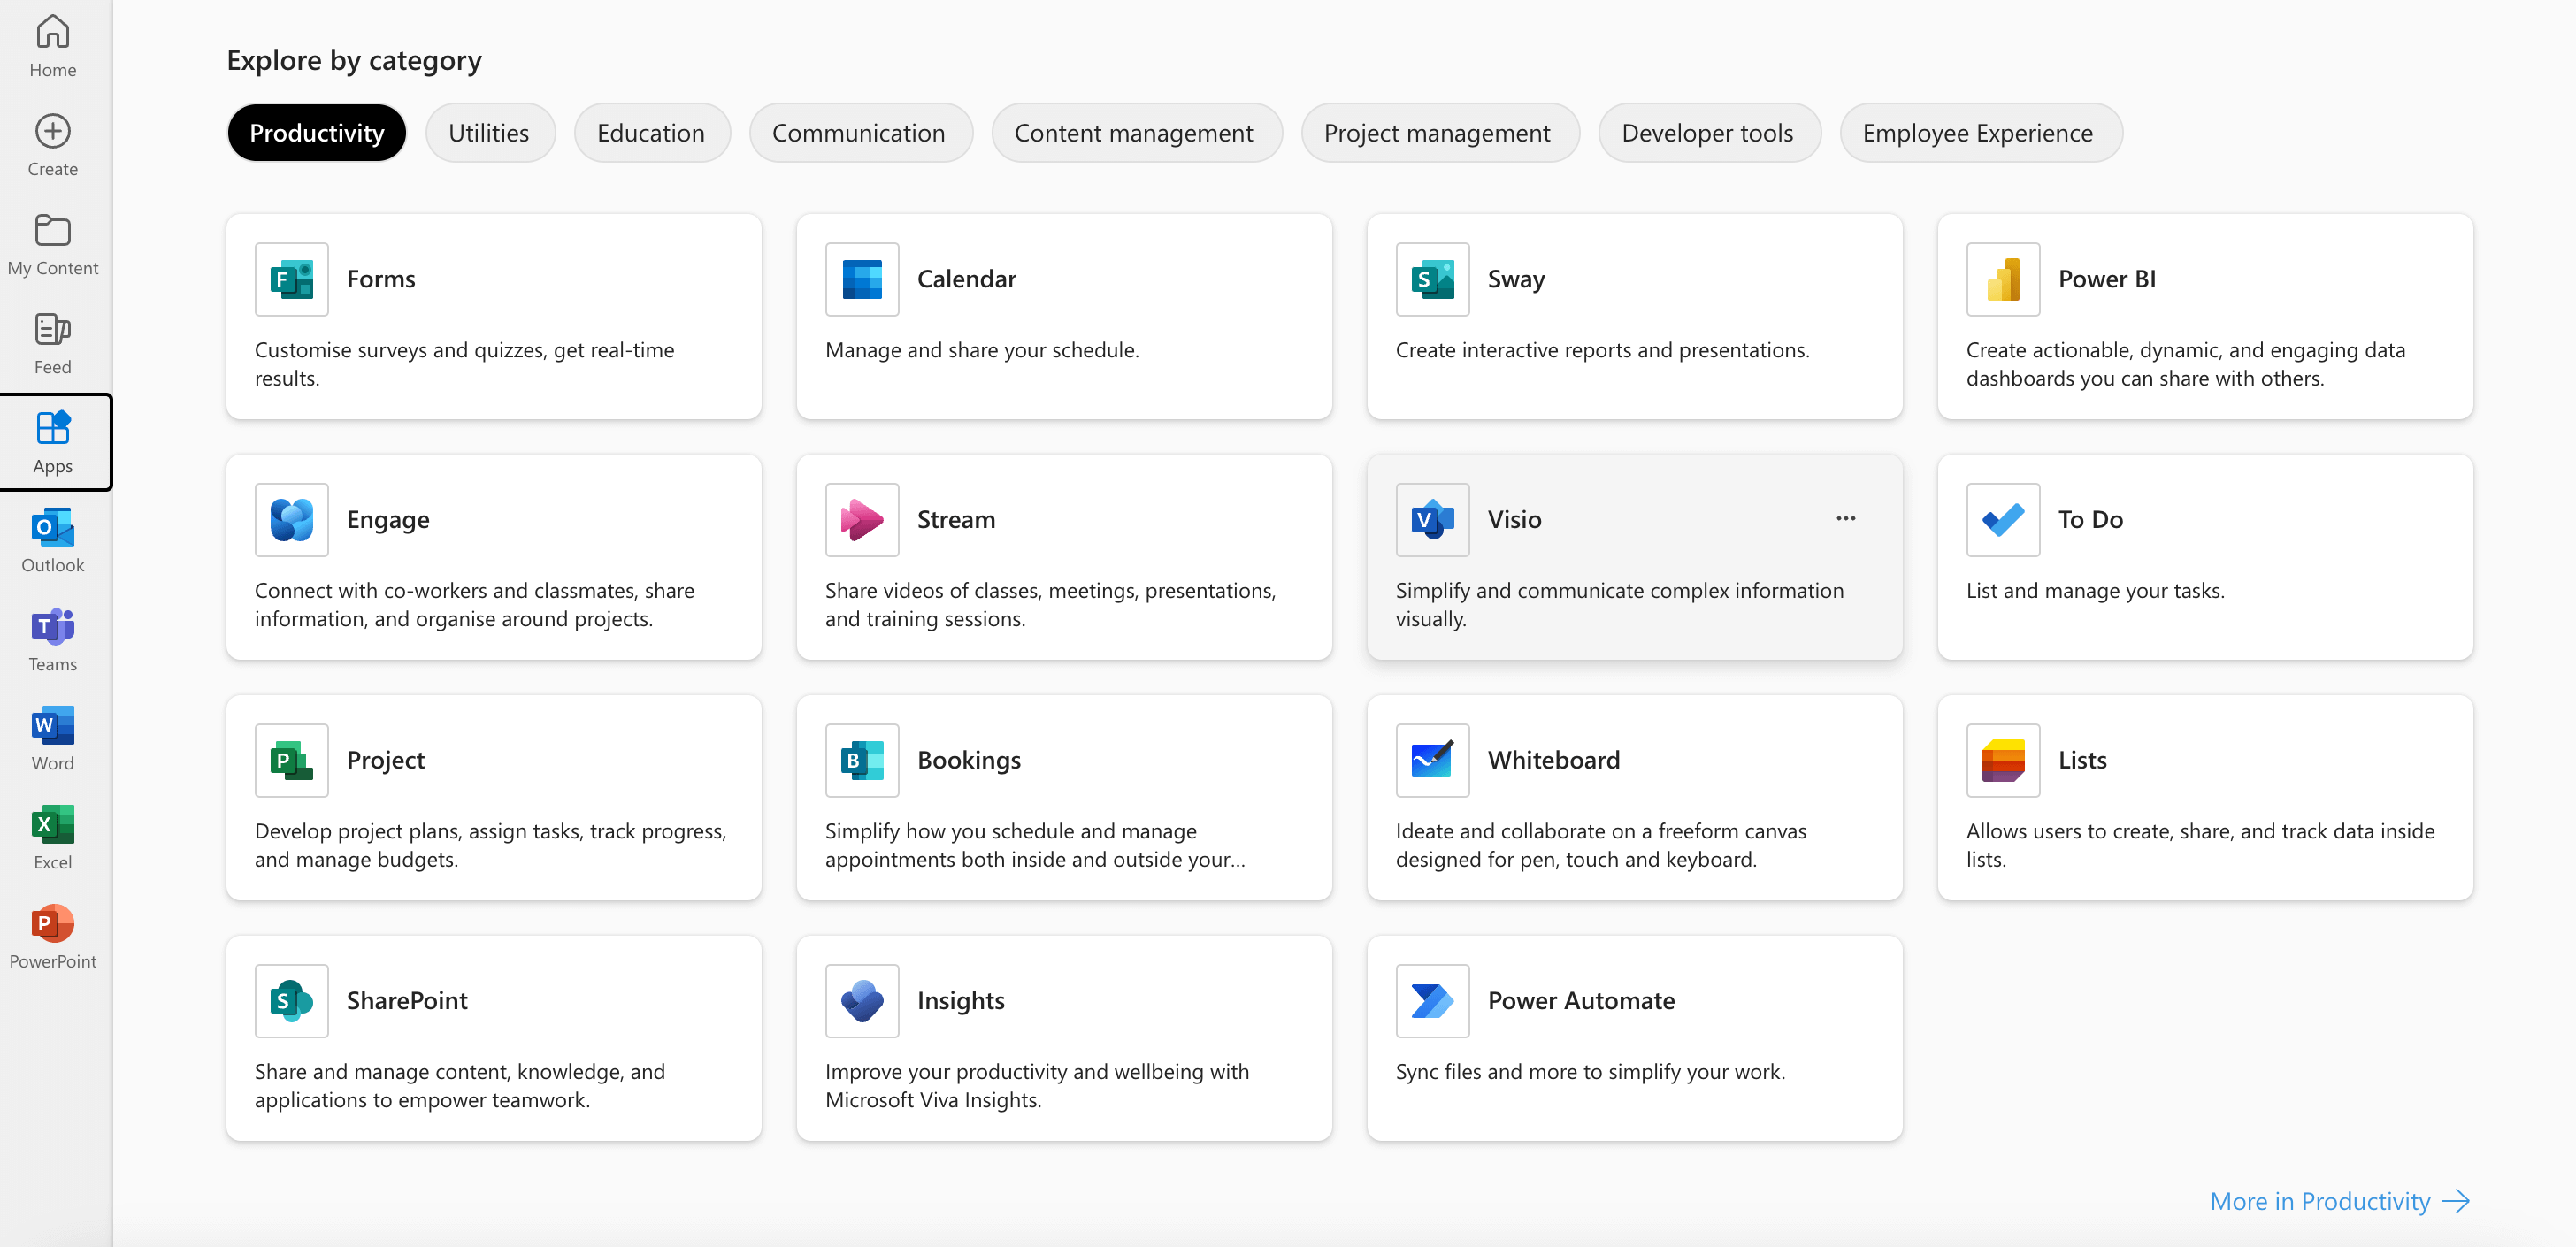
Step 1: Open Visio from the Microsoft 365 App Launcher
- Sign in to your Microsoft 365 account.
- In the app launcher, select Apps.
- Click Visio from your available apps.
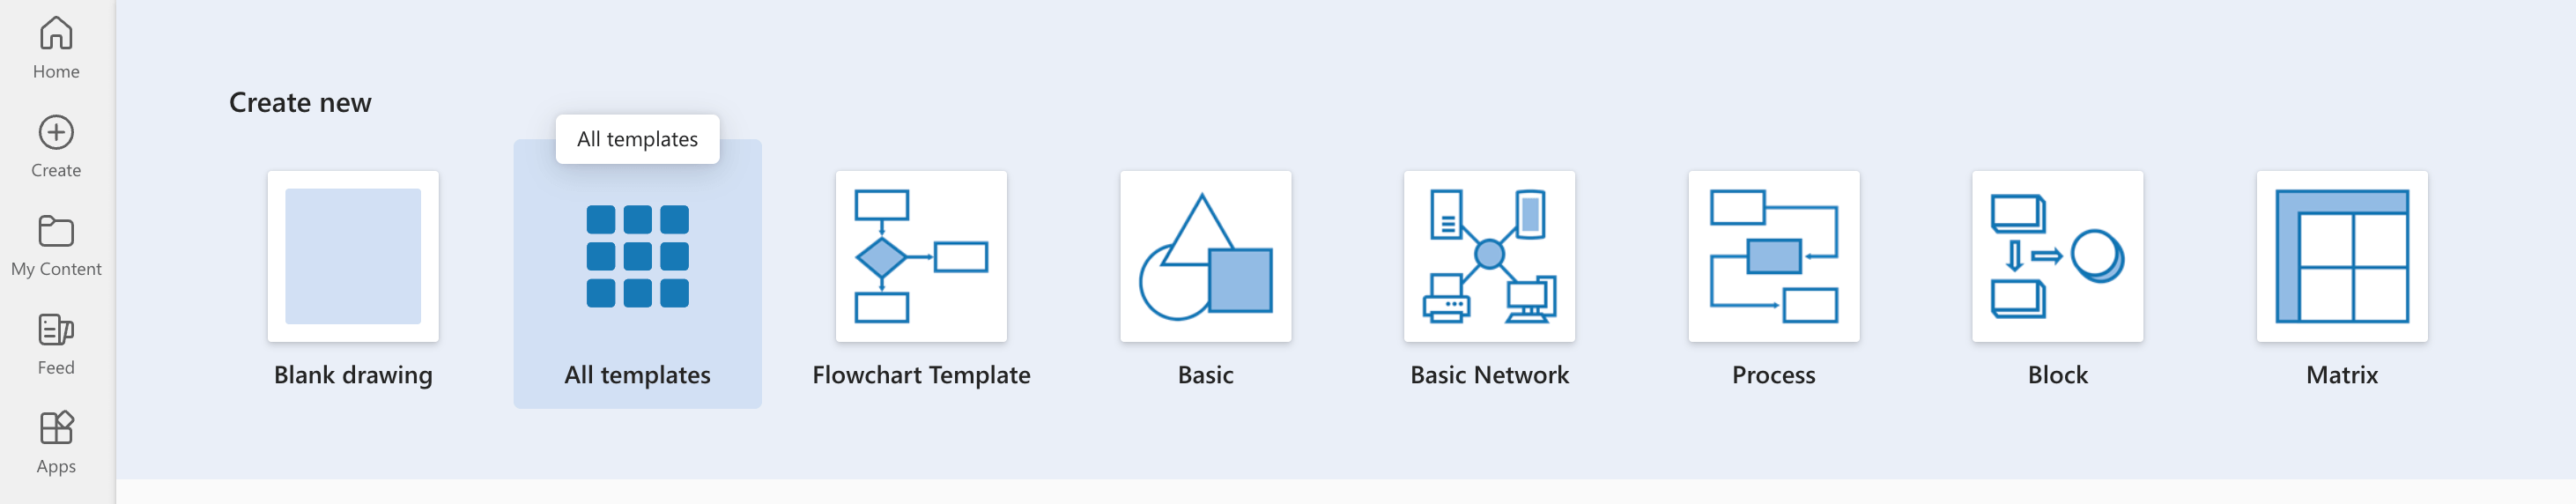
Step 2: Browse All Templates
- In Visio, look for the All Templates view.
- This shows every diagram type available in the web app, not just org charts.
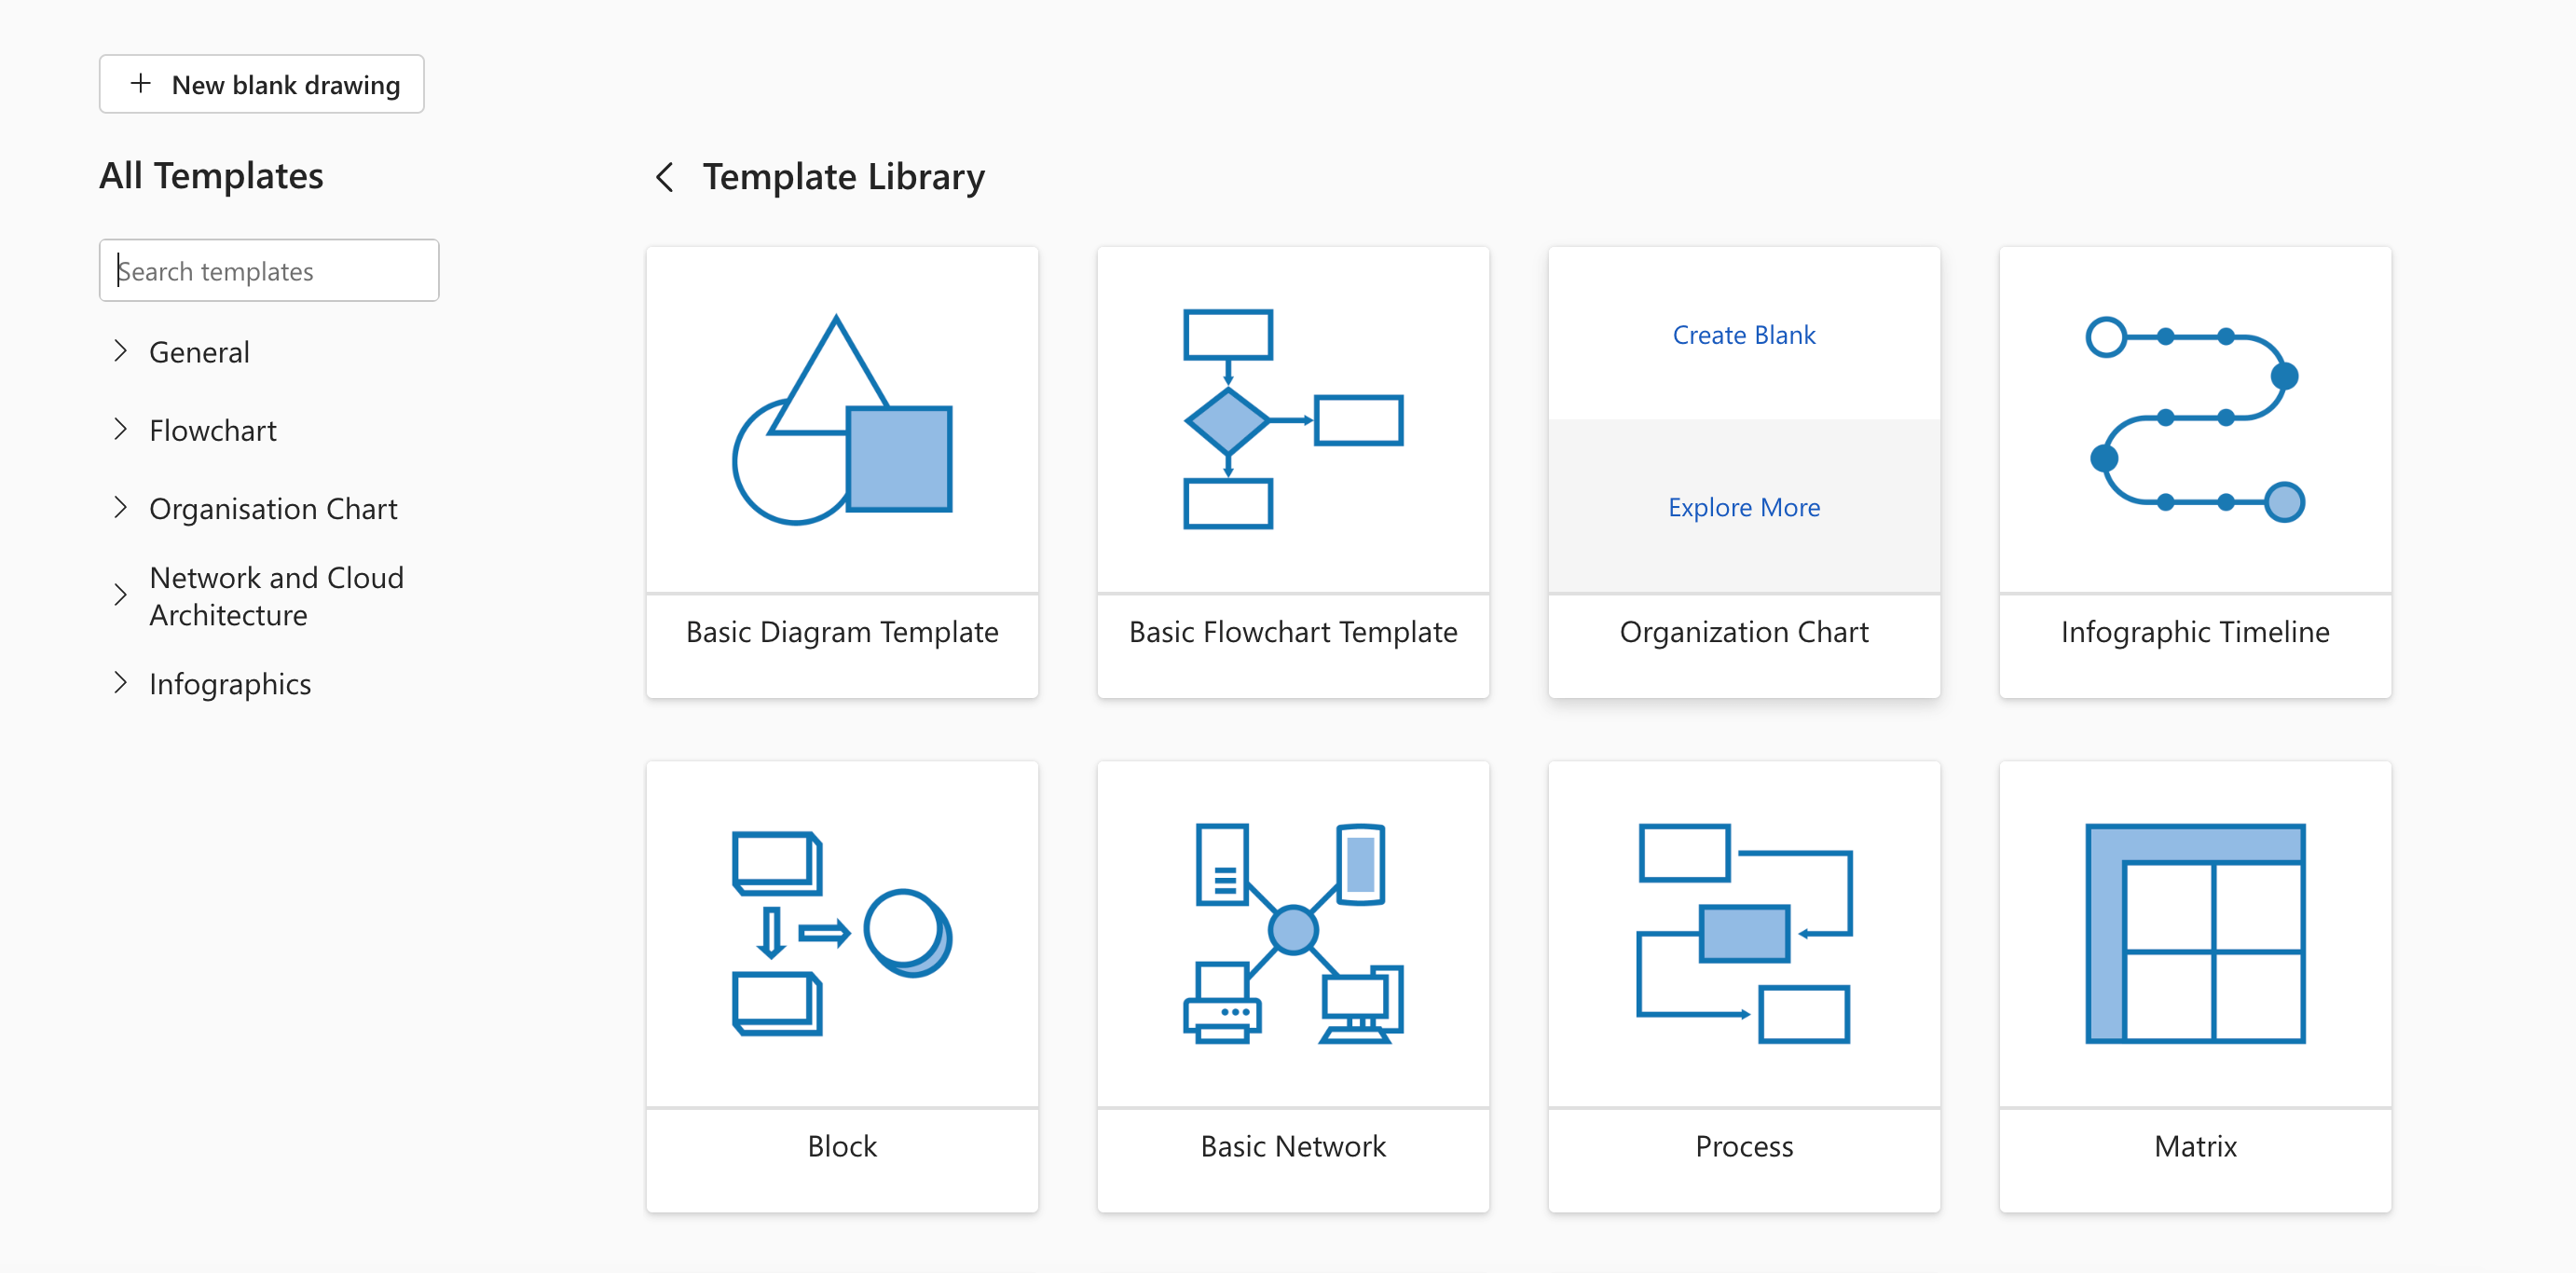
Step 3: Find More Org Chart Templates
- Locate the Organization Chart category.
- Choose the option to explore more or view all related templates.
- Hover over a template to see a quick preview or description.
Step 4: Choose and Customize Your Template
- Click a template that matches your structure (e.g. division-based, matrix, or departmental).
- Select Create to open it in Visio for the web.
- Add, remove, or rearrange shapes to reflect your real reporting structure.
- Apply branding, colors, and layout tweaks just like you did with the basic chart.
Step 5: Save and Share
- Save your customized org chart to a shared Microsoft 365 location.
- Share it via link or export it for wider distribution, just as you would with any other Visio diagram.
This approach is useful if your structure is more complex than a simple top-down hierarchy.
When Visio Works and When to Consider a Dedicated Org Chart Tool
Visio is a good fit if:
- You need a one-off or occasional org chart for presentations
- Your structure doesn’t change very often
- You want a highly customised, branded visual for senior stakeholders
Visio becomes painful when:
- Your headcount is growing quickly
- People move teams or roles regularly
- You want everyone, HR, IT, managers, employees, to always see an up-to-date chart
- You’d like org charts to update automatically from your HRIS or Microsoft 365 data
That’s where dedicated org chart and employee directory tools (like OneDirectory) are often a better long-term solution: they sync from your source of truth, support search and filters, and stay accurate without manual Visio updates.
Final Thoughts
Microsoft Visio is a solid option for building clear, professional org charts, especially if your organisation already lives in Microsoft 365 and you’re comfortable working with diagrams.
As your company grows, you might outgrow manually maintained Visio charts. When that happens, it’s worth looking at org chart tools that pull live data from Microsoft 365 and give every employee an accurate view of the organisation, without someone constantly updating shapes in Visio.