Making Sense of Human Resource Diagrams
Wondering what human resource diagrams are and how they can help you? This guide will teach you everything you need to know about HR diagrams and show you some great examples!

If you work in human resources, you know how important it is to keep track of the many tasks and processes that need to be done every day.
But with so many details to remember, staying organized can be a challenge.
That's where human resource diagrams come in handy 🙌
Human resource diagrams are different visual representations of your HR processes that can help you plan, delegate tasks, and collaborate with your teams more effectively.
There are many different types out there and they each have their own benefits and applications, so let's explore the wonderful world of HR diagrams in more detail.
What are Human Resource Diagrams?
Human resource diagrams describes a set of diagrams that help you plan and manage your human resources. Simply put, they help your HR team manage their HR processes and functions more easily.
HR diagrams are useful in a variety of circumstances.
For example, they can help you visualize certain areas of your business such as your organizational structure or office distribution. They can be used to provide clarity and structure on the tasks, roles, and responsibilities of each team member. And perhaps the biggest benefit is that they help your HR team to be more strategic with their decision-making.
There are many different types of HR diagrams, and they can include:
- Organizational diagrams of your company's organizational structures. For example, your org chart is a type of human resource diagram.
- Matrix diagrams that show the relationships between teams and projects, displayed in a grid or "matrix" format.
- Process flowcharts used for mapping out any HR process such as recruitment, training, promotions, induction, employee relations, payroll, benefits, and more.
- Fishbone diagrams to assist your HR department in identifying cause and effect relationships, and getting to the root cause of problems.
 Greg Bennett
Benefits of Using Human Resource Diagrams
An effective human resource diagram provides numerous benefits to companies of all sizes since they allow teams to plan processes and strategies, identify inefficiencies in current processes, and clarify instructions for employees.
Here are the main benefits in more detail:
- HR diagrams help define roles and responsibilities within the organization more clearly, allowing employees to understand what their jobs entail and how they fit into the overall team structure. This makes it easier for team members to collaborate effectively and efficiently.
- HR diagrams help identify areas where teams can work together more efficiently by highlighting redundancies or inefficiencies that may exist in current processes. With this information, managers can make informed decisions about increasing productivity or optimizing workflows.
- HR diagrams serve as an instructional tool for new hires so they can quickly learn what their job entails without having to spend too much time getting up to speed with the organization’s operations. This reduces onboarding time while still providing new employees with the necessary context and understanding of their role within the wider team structure.
- HR diagrams are a useful tool for performance management as they allow managers to track progress against goals or objectives. By providing visibility into which tasks are being completed, HR can ensure that employees stay on track towards meeting their career and developmental goals in a timely manner, thus increasing both productivity levels and employee satisfaction.
Different Types of Human Resource Diagrams
Human resource diagrams are an essential tool for any organization since they provide a clear picture of how the organization works, what roles different people play, and how resources are allocated.
Let's look at some of the most common types of human resource diagrams.
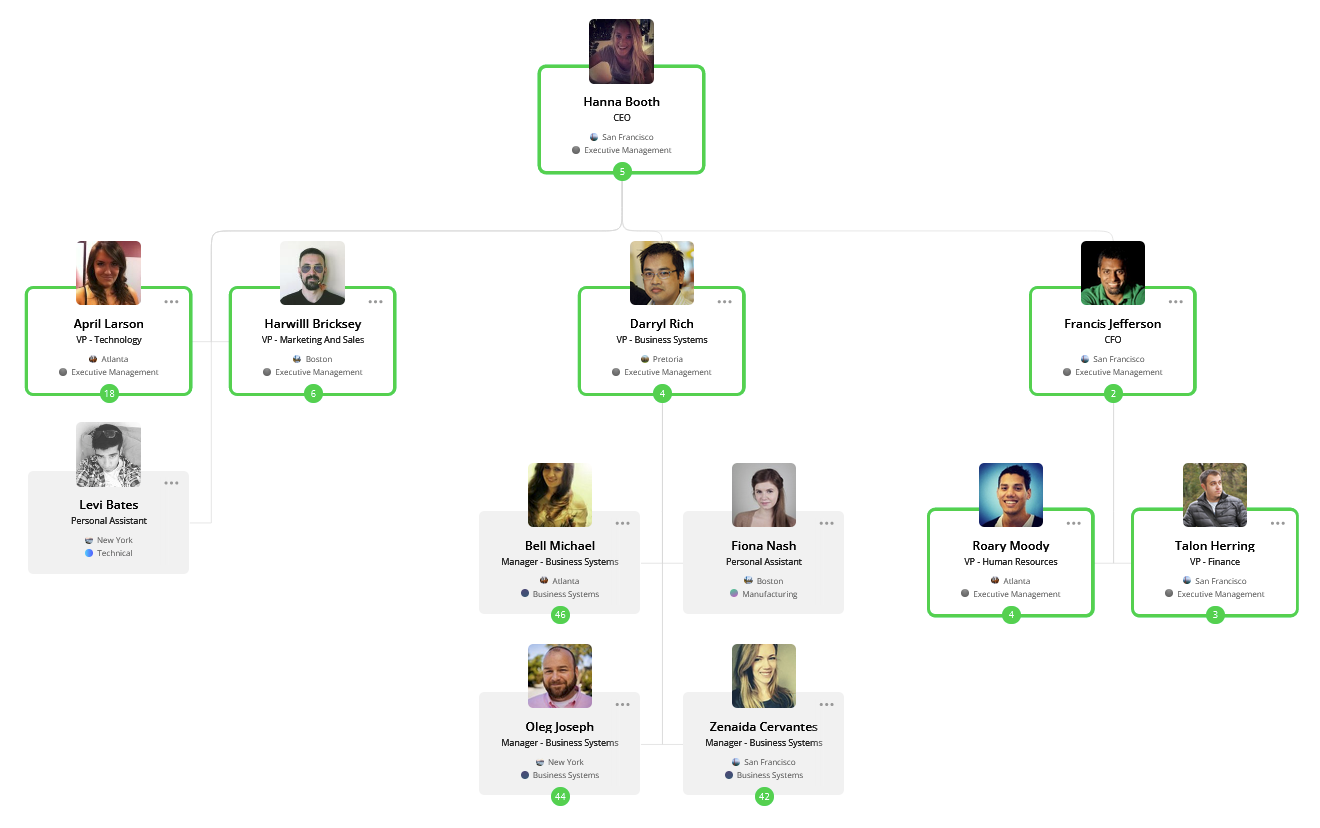
Organizational Chart Diagrams
Organizational chart diagrams are one of the most commonly used types of human resource diagrams. They provide a visual representation of an organization's reporting hierarchy, showing who reports to whom within the company.
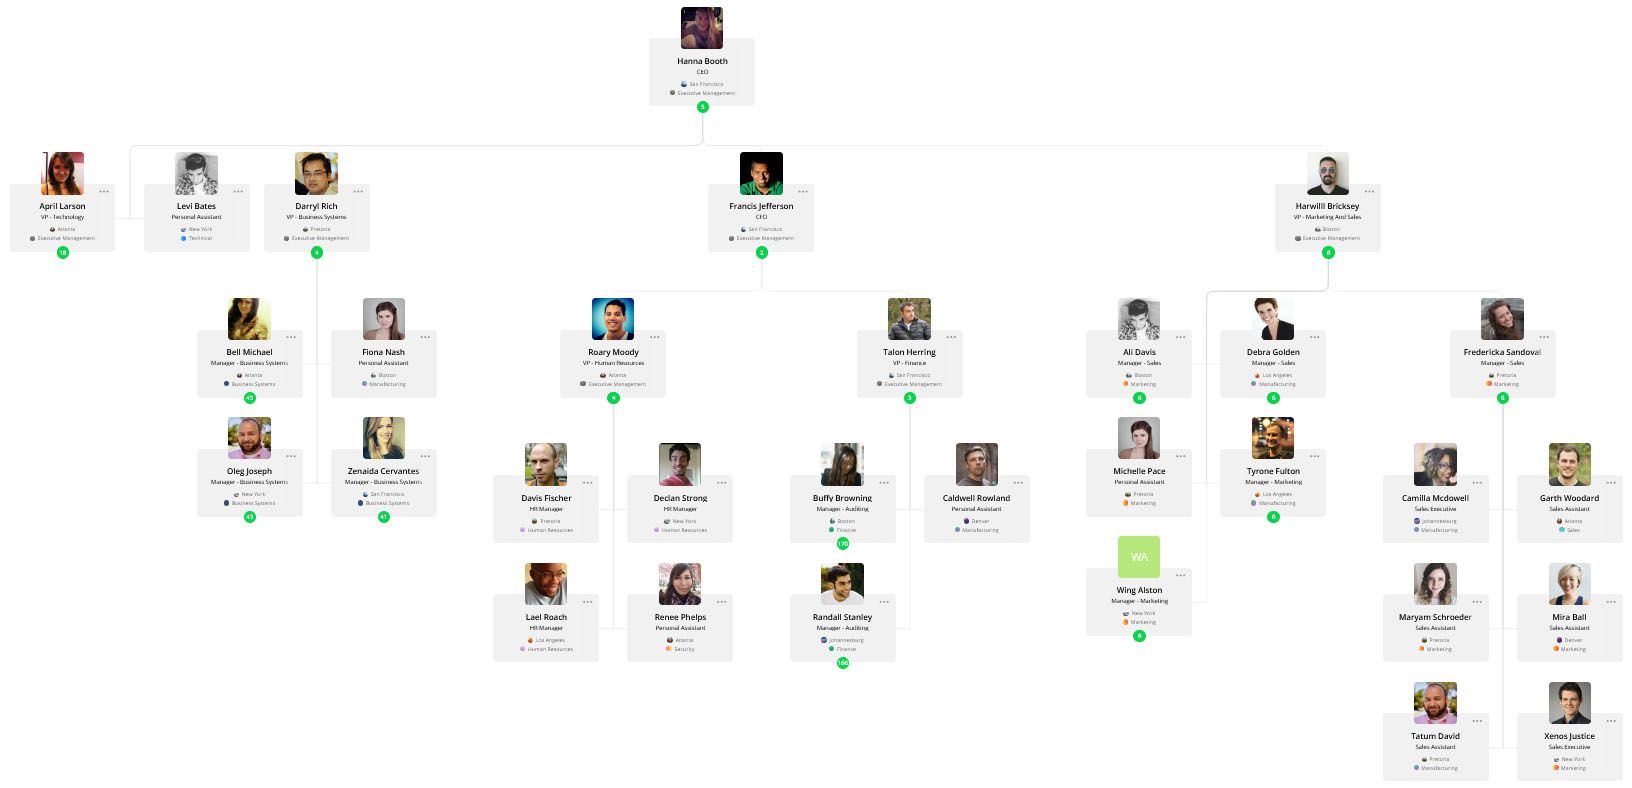
An org chart diagram is also useful for illustrating relationships between different departments or teams within an organization or highlighting certain teams or groups of individuals for planning or reporting purposes.
Human Resource Management Process Diagram
Human Resource Management (HRM) is a complex process that covers employment, training, compensation, retention, and a lot more. By breaking it down into individual steps and creating a diagram to represent each one, the overall HRM process can be easier to understand.
A typical HRM process diagram may include steps such as recruitment, training, job assignment, performance reviews, and evaluations. Each step contains an example of activities that might occur such as developing job descriptions for recruitment, or assessing employee skills during performance review.
By using an HRM process diagram you can ensure that all necessary steps are accounted for in the management of human resources, and that the skills of every employee are being utilized in the best way possible to achieve organizational goals.
Workflow Chart Diagrams
Workflow chart diagrams are another popular type of human resource diagram. In a nutshell, they illustrate the flow of work from start to finish by using symbols such as ovals, rectangles, diamonds and arrows, to represent each step in the process.
Workflow chart diagrams are useful for documenting both standard operating procedures and problem-solving activities that involve multiple participants working together. Workflow charts can also be used as training aids to help employees understand complex processes quickly and easily.

Position Description Diagrams
Position description diagrams provide a detailed view into an individual's job duties and responsibilities. These diagrams include information about the qualifications required for the role, and how their performance will be evaluated against objectives set by their manager or supervisor.
Position description diagrams can also be used to develop job descriptions that clearly outline expectations for new hires or existing employees who may have been promoted into a new role within the organization.
Competency Model (Diagrams)
Competency models are used to assess a company's current employee skill levels as well as identify any skill gaps that need to be filled in order to reach organizational goals. They provide organizations with an efficient way to identify potential candidates for promotions or new hires who possess the necessary skill-sets needed to fill open positions within the company.
The assessment process typically involves creating a list of competencies (or skills) required for specific roles within an organization and then assessing individual employees against those competencies in order to determine their level of proficiency in each area. A competency model diagram can then be used to help visualize the results of the assessment.
Cost-Benefit Analysis Diagrams
Cost-benefit analysis diagrams, in the context of HR, are used by organizations to evaluate the costs associated with hiring and retaining certain employees versus the benefits they bring to the company over time.
Organizations typically use this type of diagram to calculate employee salaries, bonuses, and training costs, as well as measure employee productivity and performance over time. Often, this is to determine whether it is more cost effective to retain that employee or to hire someone new who may be better suited for the position.
Team Structure Diagrams
Team structure diagrams are similar to organizational charts but focus on a smaller group—usually a single team or department—rather than the whole organization. This type of diagram helps break down individual teams and shows who is responsible for which tasks within the team's scope of work.
Team structure diagrams can also be helpful for identifying areas where there may be a need for additional team members or an overlap in responsibilities.
Lawrence Cawood
Accountability Chart Diagrams
Accountability chart diagrams are a great way to keep track of data-driven tasks and processes. They provide an easy-to-read visual representation of who's responsible for what.
By simply taking the time to create an accountability chart, you can maintain structured accountability throughout your team or organization.
Accountability charts are especially useful for ensuring that all assignments are met efficiently and without fail, and the visual display helps team members remember deadlines and to see who is in charge of certain tasks.
Greg Bennett