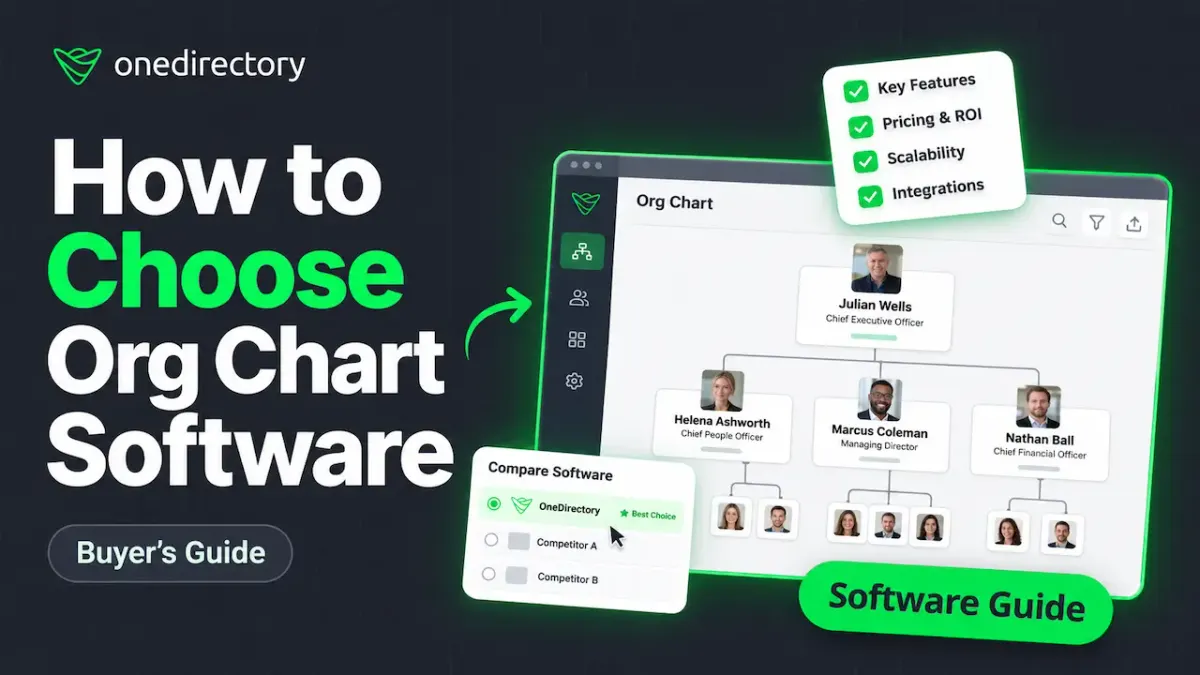
How to Choose Org Chart Software
We analyzed 15,000+ reviews across G2, Capterra, and TrustRadius for the major org chart tools. The patterns reveal what pricing pages and feature lists do not.
Org chart software splits into three jobs. Some tools keep a live chart that updates when someone joins, leaves, or moves. Some build static charts you design by hand for a board pack. Some model future structures that do not exist yet.
Most buyers buy the wrong type and find out six months later. We collected review data from G2, Capterra, and TrustRadius covering over 15,000 reviews across the major org chart and employee directory tools on the market. The patterns tell you what pricing pages do not.
The tools we analyzed and how we did it
We studied public review data for 10 tools that include org chart functionality: Sift, BambooHR, Pingboard/Workleap, OrgChart by OfficeWork Software, Organimi, ChartHop, GoProfiles, Happeo, Employee Directory 365, and OneDirectory. OneDirectory is ours. We include it in the dataset, disclose its review count, and do not exclude data that makes it look small.
For each tool, we visited its G2, Capterra, and TrustRadius product pages and recorded the structured data each platform publishes: review theme counts, feature satisfaction scores, company-size breakdowns, and the pros and cons the platforms surface from their own analysis.
We used the aggregate patterns the review platforms themselves generate and made them comparable across platforms. Pricing was verified against each vendor's website. Six of the tools were tested hands-on with a 1,000-person demo dataset built to include multiple offices, divisions, dotted-line reporting, and service accounts.
Who is buying org chart software, and who is not
70-97%
of G2 reviewers are mid-market or enterprise (51+ employees)
3-7%
of reviewers are small business in dedicated org chart tools
Below about 150 people, almost nobody buys dedicated org chart software. They use what is built in. Microsoft 365 users already have Org Explorer. The review data suggests buyers move to dedicated tools when multiple offices, dotted-line relationships, and structural complexity make Org Explorer inadequate.
Source: G2.com reviewer demographic data for 10 org chart and employee directory tools, November 2026.
Across G2, reviewer demographics for org chart tools skew heavily mid-market and enterprise. The range is 70-97% of reviewers from organizations with 51 or more employees, depending on the tool. Some draw as high as 70% enterprise (1,000+ employees). Our Employee Directory and Org Chart Statistics 2026 benchmark breaks these numbers down further.
Small businesses are a minority across the category. In the dedicated org chart tools (as opposed to HRIS platforms), they make up 3-7% of reviewers.
Microsoft 365 users already have Org Explorer built in. It shows reporting lines pulled from Entra ID. For organizations under about 150 people with a simple hierarchy, that is usually enough. The review data suggests buyers move to dedicated tools when multiple offices, dotted-line relationships, contractors, and structural complexity make Org Explorer inadequate. That threshold is editorial judgment, not a measured cutoff, but the reviewer demographics support it: the people paying for and reviewing these tools are mid-market and enterprise, not small businesses.
The three problems the review data keeps surfacing
1. The tools employees want to use are not built for what HR needs
The review data splits the category cleanly.
Tools built for end users (people looking up colleagues, navigating the org) score 4.4-4.7 out of 5 for Ease of Use on Capterra. Reviewers praise "intuitive" and "clean" interfaces hundreds of times across the dataset.
Tools built for HR and admins (HRIS-connected charting, workforce planning) score lower. A tool with 304 G2 reviews and deep HRIS integrations (9.0/10 for data connectivity on G2) scores 3.9/5 for Ease of Use on Capterra, the lowest in the category. Its reviewers cite a steep learning curve 20+ times on G2.
Built for employees
4.4-4.7/5 Ease of Use on Capterra. "Intuitive" and "clean" cited hundreds of times.
Built for HR/admin
3.9/5 Ease of Use on Capterra. 20+ G2 mentions of steep learning curve.
Source: G2 and Capterra review data for 10 tools, November 2026.
I tested both types against a 1,000-person demo environment. The admin-grade HRIS-connected tools generated accurate charts from the source data without manual work. But the interfaces felt built for database administrators, not for the 500 people who might actually want to look someone up. The directory-and-chart tools were the opposite: employees could find colleagues in seconds, but the admin controls were limited.
Nobody has solved both. That trade-off determines which type of tool you should be evaluating.
2. Scenario planning tools are a different product wearing the same label
One category of tool gets 31 G2 mentions for "planning and scenario tools" but scores just 8.0/10 for integration (lowest among the major tools in the org chart category) and draws 9+ mentions of "complexity" and "confusing permissions." For more on the distinction, see What Is Org Planning?
That is because planning tools are not org chart software. They are people analytics and workforce modeling platforms that include an org chart view. Reviewers who need headcount planning love them. Reviewers who need to see who reports to whom find them overbuilt and expensive.
If "scenario planning," "headcount modeling," or "reorg simulation" appear in your requirements, you are shopping for a different category. Those tools start at $5/employee/month and can reach $20+ with add-ons. At 1,000 employees, that is $60,000 to $240,000 a year. If you just need people to find colleagues and see the reporting structure, you are overpaying by an order of magnitude.
3. The printing and export problem
Across Capterra and G2, complaints about chart printing, PDF export, and zoom behavior appear for every tool that renders a visual org chart. The themes repeat:
- Charts require constant zooming and lose detail at scale
- Charts cannot display beyond a certain number of tiers
- Printing and pagination require manual work
- One tool with 531 G2 reviews has 8 mentions of org chart printing issues alone
This sounds trivial until you need to attach an org chart to a board pack, a compliance filing, or a new-executive briefing. During your trial, do not just navigate the chart in a browser. Export it to PDF. Print it. Try to fit a 200-person department on a single page.
What G2 reviewers complain about most in org chart tools
Source: G2.com structured review theme analysis across 10 tools, November 2026.
The four types of org chart software
Understanding which type you are looking at prevents the most expensive mistake in this category: buying a $60,000/year planning platform when a $7,000 directory does the job, or buying a $600 chart builder and discovering nobody maintains it. Our Best Org Chart Software comparison tests 11 tools across all four types.
Type 1: Live directory with org chart
Built for every employee to search, browse, and navigate the org. The chart syncs from your identity system and updates automatically.
On G2, these tools have the highest ease-of-use concentration and the highest "Good Partner" scores (up to 10.0/10). They also score 9.0/10 for Integration, tied for the category best. Their weakest area: "Restructure" scores as low as 6.7/10, because these tools show the organization as it is, not as it could be.
Typical buyer: IT, internal comms, or operations. The goal is adoption across the whole company.
At 250 employees: roughly $3,500-$12,000/year, depending on the tool and plan tier.
Type 2: HRIS-connected org chart
Built for HR teams to generate, publish, and analyze org charts from their HR system data. Position-based charting, historical views, workforce analytics.
The highest integration scores in the category (9.0/10 on G2). But also the steepest learning curves: 3.9/5 Ease of Use on Capterra, 20+ G2 mentions of complexity. These are power tools for HRIS admins, not tools you hand to every employee.
Typical buyer: HR operations, people analytics. The goal is accurate published charts from HR data.
At 100 employees charted: roughly $1,260-$3,150/year, scaling with headcount and tier.
Type 3: Planning and analytics platform
Built for HR leadership and finance to model future org states, plan headcount, run scenarios, and analyze compensation. The line between org chart software and organizational design blurs here.
The highest "Restructure" scores (8.7/10 on G2). Strong feature depth. But the lowest integration scores (8.0/10), complaints about complexity (9+ mentions), and vendor stability concerns: a $74M-funded company in this space went from 132 to 62 employees between 2023 and 2026.
Typical buyer: VP of People, CFO, org design teams.
At 250 employees on the base plan: roughly $15,000/year. With add-ons for compensation, performance, and headcount planning, the same 250 employees can reach $50,000+/year. At 1,000 employees, $60,000 to $240,000/year depending on modules.
Type 4: Chart builder / diagramming
Built for creating static org charts by hand. Drag and drop, templates, CSV import. The chart exists as a document, not a live system. If you just need a chart for a presentation, tools like PowerPoint, Word, Visio, or Excel may be enough.
Praised for ease of use and quick setup. Budget-friendly. The cheapest option in the category by far.
At any size: free to $600/year.
The catch is real. Every new hire, every departure, every promotion means someone has to update the chart. At 50 employees this is manageable. At 500 it becomes a recurring project nobody wants to own, and the chart falls out of date within weeks. We wrote about the real cost of outdated org charts and why this maintenance burden is the reason most organizations eventually move to an automated tool.
What org chart software costs by type
Annual cost at 250 employees. Verified November 9, 2026.
| Tool type | At 250 emp. | Per person/mo |
|---|---|---|
| Chart builder | $0-$600 | $0-$0.20 |
| HRIS-connected chart | $3,150+ | $1.05+ |
| Live directory + org chart Banded or flat annual fee | $3,500-$12,000 | $1.17-$4.00 |
| Planning platform | $15,000+ | $5.00+ |
| Full HRIS (chart included) | $30,000-$75,000 | $10-$25 |
Per-user pricing compounds. A $4/employee/month tool costs $12,000/year at 250 employees, $48,000 at 1,000, and $144,000 at 3,000. Banded and flat-fee pricing gets cheaper per person as you grow.
The five questions to answer before evaluating tools
1. What is the job?
- "Everyone should be able to find anyone" -> Type 1 (live directory with org chart)
- "HR needs to publish accurate charts from our HRIS" -> Type 2 (HRIS-connected)
- "We are planning a restructure and need to model scenarios" -> Type 3 (planning platform)
- "I need a chart for a board deck next week" -> Type 4 (chart builder, or your HRIS built-in)
2. Where does your org data live?
If your source of truth is Microsoft Entra ID, your org chart tool should read from Entra ID directly. If it is Workday, it should connect to Workday. The tools that sync automatically keep charts accurate without anyone touching them. The tools that do not depend on someone updating the chart by hand, and that person never has time.
Across 65 organizations (self-selected: every one had already decided its directory needed work), we measured manager-field coverage going from 42% at first sync to 79% after cleanup. The tool made the gaps visible. Fixing them required people. At a 500-person company, reconciling manager fields alone took 20-40 hours of admin time before the org chart became trustworthy. We published the data: 5 missing employee data fields that quietly break your org chart.
3. Who needs to see it, and where?
If the chart is for every employee, it needs to live where they already work. For Microsoft 365 organizations: a browser and a Teams tab. For Google Workspace: a tool with familiar SSO.
If the chart is for HR only, access controls and publishing workflows matter more than daily usability.
4. How complex is your structure?
A simple hierarchy (one manager, one department, one office per person) is easy. Most tools handle it. The complexity that breaks tools: dotted-line and matrix reporting, multiple locations for the same team, contractors and service accounts that should be excluded, and divisions or subsidiaries that need separate but connected charts. Test these specific scenarios in a trial. The demo always shows the simple case.
5. What does it cost, and what happens at renewal?
Per-user pricing compounds. A $4/employee/month tool costs $12,000/year at 250 employees, $48,000 at 1,000, and $144,000 at 3,000. Banded or flat-fee pricing gets cheaper per person as you grow.
Renewal pricing is volatile in this category in 2026. At least one vendor restructured pricing after an acquisition, with customers reporting 3-5x increases at renewal. At least two restructured pricing models within a single year. Get the renewal price in writing.
The evaluation checklist
Data accuracy:
- Change a job title in your identity system. How fast does the chart update?
- Add a new hire. Does the chart place them correctly without manual work?
- Remove someone. Does the chart handle it cleanly?
- Show dotted-line and matrix relationships.
Navigation:
- Search for a person by partial name
- Navigate from one person to their skip-level manager in three clicks
- View the chart on a phone
- Open a department with 50+ people without the chart becoming unreadable
Export and sharing:
- Export the full chart to PDF
- Print a department chart on a single page
- Share a link to a specific person in the chart
Cost:
- Annual cost at your current headcount
- Annual cost at 2x your headcount
- Renewal pricing, in writing
- Implementation, support, and integration fees
When you do not need org chart software
Under 150 employees on Microsoft 365. Org Explorer shows reporting lines from Entra ID. It is free, built in, and accurate if your Entra data is maintained. You outgrow it when you need search by skill or department, profiles with photos and contact details, office pages, dotted-line relationships, or control over who can see what.
You need one chart, one time. For a board deck or a compliance filing, Visio, Miro, or PowerPoint will do. Do not buy annual software for a quarterly deliverable.
Your HRIS already has a usable org chart. Log in and test it. Navigate it. Search it. If it works for the people who need it, you are done.
Your problem is data accuracy, not visualization. If manager fields are empty, titles are wrong, and departments are outdated, drawing that data on a chart just makes bad data look official. Fix the source data first. The data problem is fixable, but fixing it is a people project, not a software purchase.
Frequently asked questions
What is the best org chart software for Microsoft 365?
For a Microsoft 365 organization, the best org chart tool reads from Entra ID on every sync so the chart stays current without manual updates. Look for native Entra ID sync, a Microsoft Teams app, and the ability to handle dotted-line relationships and multiple offices. The built-in Org Explorer covers basic reporting lines; dedicated tools add search, profiles, skills, office pages, and visibility controls. See our Best Org Chart Software comparison for tested options.
How much does org chart software cost?
It ranges widely by type. Chart builders: free to $600/year. Live directory-and-chart tools: $3,500 to $12,000/year at 250 employees. HRIS-connected charting: $1,260 to $3,150/year starting at 100 employees. Planning platforms: $15,000+/year at 250 employees, potentially over $200,000/year at 1,000 employees with add-ons. Per-user pricing compounds with headcount; banded pricing gets cheaper per person as you grow.
Which org chart tools update automatically?
Tools that sync from an identity system (Entra ID, Google Workspace) or an HRIS (Workday, ADP, UKG) can update automatically on a schedule. Chart builders (Organimi, Lucidchart, Miro, draw.io) require manual updates or CSV re-import. The key question is whether the tool reads from your source of truth directly or depends on someone re-importing a file.
Do I need org chart software if my HRIS has one?
Test your HRIS org chart first. If employees can navigate it, search it, and find the person they need, your HRIS may be enough. Dedicated tools add value when the HRIS chart is hard to find, hard to navigate, missing dotted-line relationships, or does not support the structural complexity your organization needs (multiple divisions, matrix reporting, contractor visibility controls).
What is the difference between org chart software and organizational design tools?
Org chart software shows your organization as it is today. Organizational design tools (sometimes called workforce planning platforms) model future states: what happens if you restructure a division, merge teams, or hire 50 people in Q3. These are different products at different price points. If you need to see who reports to whom today, you need an org chart. If you need to model what happens next quarter, you need a planning tool. Buying both is valid but expensive.
Methodology
We studied 10 employee directory and org chart tools. For each tool, we visited its public product pages on G2, Capterra, and TrustRadius and recorded the structured data each platform publishes: review theme counts and mention frequencies, feature satisfaction scores, company-size segmentation (G2's reviewer demographics), and the pros/cons summaries the platforms generate from their own analysis.
Pricing was verified against vendor websites as of November 9, 2026. We tested six tools hands-on with a 1,000-person demo dataset built to include multiple offices, divisions, dotted-line reporting, and service accounts.
OneDirectory is one of the tools in the dataset. We built it. Our org chart is a live, automatically updated view for employee navigation, not a planning or design tool. We state what it does and what it does not.
Related reading: Best Org Chart Software in 2026 | How to Choose Employee Directory Software | Employee Directory and Org Chart Statistics 2026 | How Employees Actually Find Colleagues | What Is an Organigram?